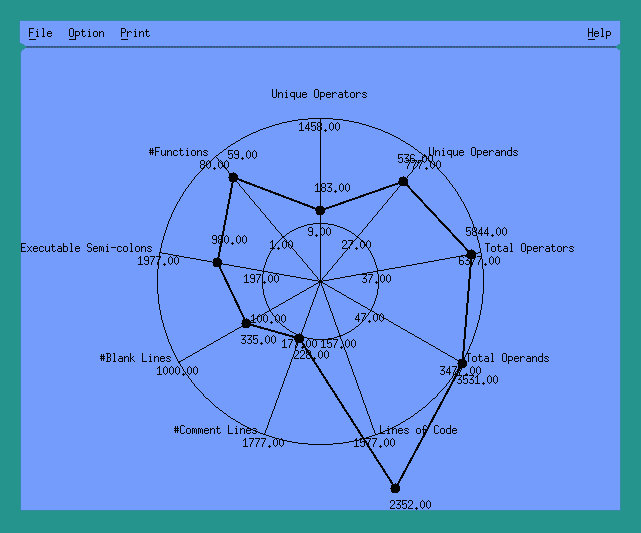
For easy viewing METRIC also produces Kiviat charts,
like the one shown below,
which graphically depict the quantitative information in the
METRIC Summary Report.
Each "spoke" of the Kiviat chart represents a metric, and results
are plotted with reference to user-defined thresholds.
These results shown here are taken directly from the Summary Report.
The user can alter the threshold values
(the values on the concentric rings) to suit internal process specifics.
